25 Jul 2026
Aligning Alert Systems with Archive Charts for Tennis Breakpoint and Football Set Piece Opportunities
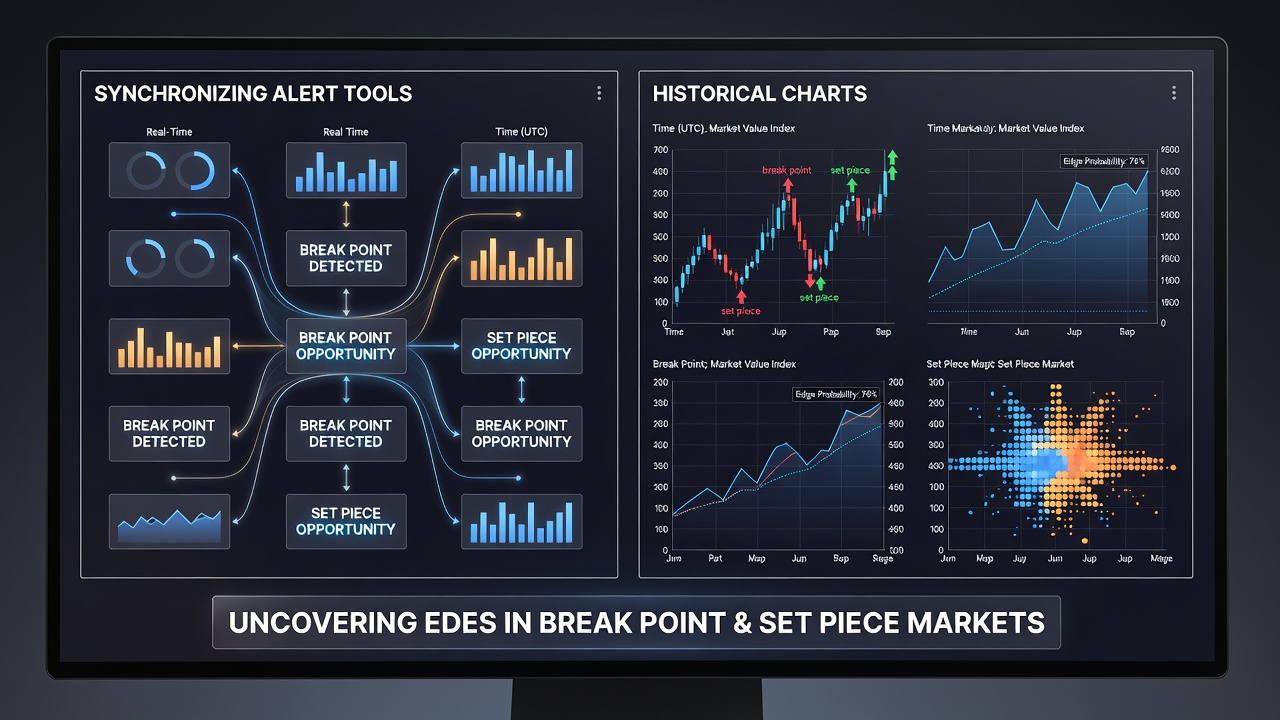
Traders and analysts in sports markets have long combined notification systems with past performance visuals to locate advantages in tennis breakpoint situations and football set piece scenarios, and this approach continues to expand in July 2026 as data volumes grow across major tournaments and leagues.
Core Components of Alert Mechanisms
Alert tools operate by monitoring live odds feeds and statistical thresholds, then sending notifications when predefined conditions appear, such as a tennis player reaching breakpoint conversion rates above historical averages or a football side recording corner attempts that exceed league norms. These systems draw from multiple exchanges and bookmakers simultaneously, allowing users to act on shifts before markets adjust fully, while the underlying logic relies on rule-based triggers rather than manual observation alone.
Researchers at institutions like the University of Nevada's gaming studies program have documented how such automated signals reduce reaction times in volatile in-play environments, particularly during extended rallies or dead-ball restarts where patterns emerge quickly. Data from European betting exchanges shows that alerts tied to real-time serve percentages and set piece delivery accuracy produce measurable timing benefits across both sports.
Role of Historical Charts in Pattern Detection
Historical charts compile years of match data into visual formats that highlight recurring sequences, including breakpoint save percentages by surface type or set piece conversion rates under varying defensive formations. Analysts review these graphs to establish baselines before live events begin, which helps separate random variance from repeatable tendencies in player or team behavior. Charts often segment data by tournament stage, weather conditions, or opponent strength, creating layered references that alert tools can reference during active play.
Integration Process for Breakpoint Markets
Synchronization begins when historical breakpoint data feeds into alert parameters, so notifications activate only when current match conditions align with past high-value setups. For example, one analysis of Grand Slam matches revealed that certain players convert breakpoints at elevated rates after losing the previous service game, and alert configurations now incorporate this sequence to flag opportunities in similar contexts. The process uses API connections between charting software and notification platforms, allowing continuous comparison of live metrics against stored distributions without manual recalibration each match.
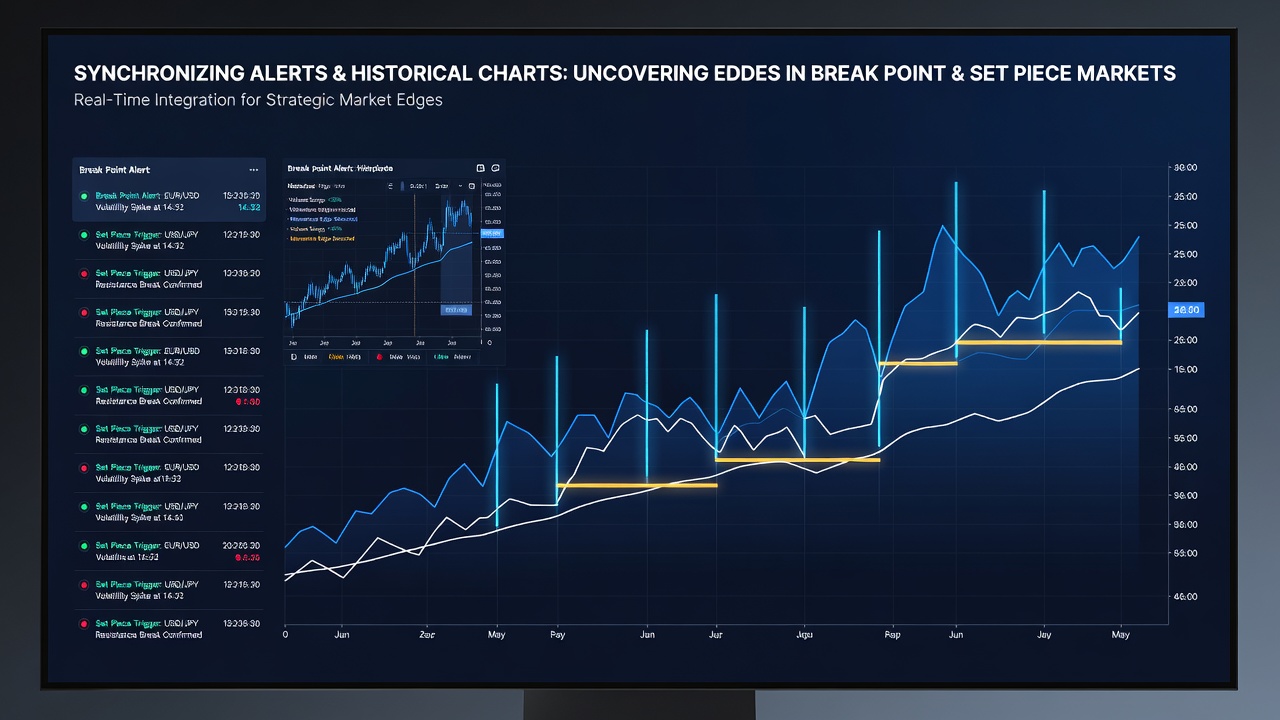
Those who have studied tennis data across multiple surfaces note that clay court breakpoint patterns differ markedly from hard court equivalents, and integrated systems adjust thresholds accordingly based on the event location. This layered approach draws from records maintained by organizations such as the American Gaming Association, which tracks technology adoption rates among market participants.
Application to Football Set Piece Markets
Football set piece analysis follows a parallel structure, where historical corner and free kick outcome charts inform alert rules for live corner counts or delivery success rates. Teams that historically generate set piece threats after sustained pressure sequences trigger notifications when those conditions reappear during a match, and the same historical layers account for variables like time remaining and score differential. Observers note that leagues with consistent set piece data archives, including those tracked by Australian wagering regulators, provide clearer baselines for these comparisons than newer competitions.
Integration here often involves combining multiple data streams, so an alert might reference both a team's historical direct free kick accuracy and current defensive personnel on the pitch. Studies from Canadian research groups have examined how such combined signals perform across domestic leagues, showing consistent timing improvements when historical context filters out low-probability alerts.
Technical Synchronization Methods
Practitioners achieve synchronization through shared databases that update alert parameters from chart revisions in real time, often using scripting languages to pull historical averages into live monitoring dashboards. The setup allows for dynamic recalibration when new match data arrives, ensuring alerts reflect the most recent tournament or season trends rather than static season-long figures. External sources including academic papers hosted by the European Gaming and Betting Association describe similar architectures used by professional syndicates operating across tennis and football markets.
July 2026 has seen increased adoption of cloud-based platforms that host both chart repositories and alert engines on single infrastructures, which reduces latency between historical reference checks and live notifications. These platforms handle the volume of data generated during simultaneous Grand Slam and European league fixtures without requiring separate monitoring stations.
Conclusion
The combination of alert tools and historical charts provides structured access to patterns in breakpoint and set piece markets by linking live conditions to established performance records. Continued refinement of these systems depends on expanding data sources and improved integration protocols, which market participants across regions continue to develop as tournament calendars progress through the year.