10 Aug 2026
Charting Liquidity Discrepancies Across Parallel Markets: Aligning Scanner Alerts with Historical Drift Data for Cross-Sport Portfolio Stability
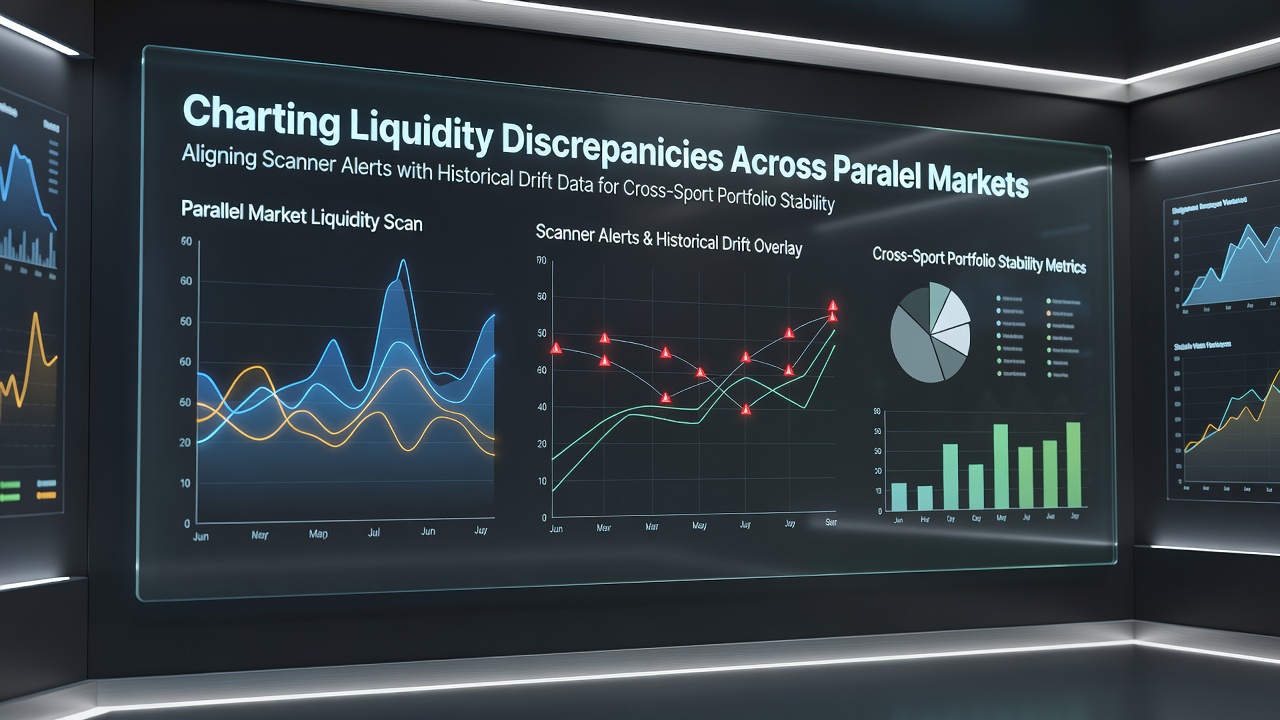
Markets for major sporting events often operate across exchanges and bookmakers that run in parallel, and liquidity levels shift at different rates depending on volume, timing, and regional participation. Scanners track these movements in real time while historical drift records supply context that helps align alerts with established patterns, and the combination supports adjustments in portfolios that span tennis, football, and other disciplines.
Parallel Market Structures and Liquidity Variations
Exchanges in different jurisdictions process wagers on the same fixtures yet maintain separate order books, so one platform may show thin liquidity on a particular outcome while another holds deeper reserves. Data compiled by the Alcohol and Gaming Commission of Ontario indicates that average depth on major football matches can differ by as much as 18 percent between leading European and North American platforms during evening sessions. These gaps widen further when events cross time zones, because participant pools change and capital flows follow local trading hours.
Researchers tracking order-book snapshots over multiple seasons have noted that liquidity discrepancies appear most consistently around line movements triggered by team news or weather updates. Scanners flag these moments as soon as volume thresholds are crossed, yet the alerts gain reliability only when matched against drift histories that show how similar signals resolved in prior cycles.
Scanner Alerts and Their Integration with Drift Histories
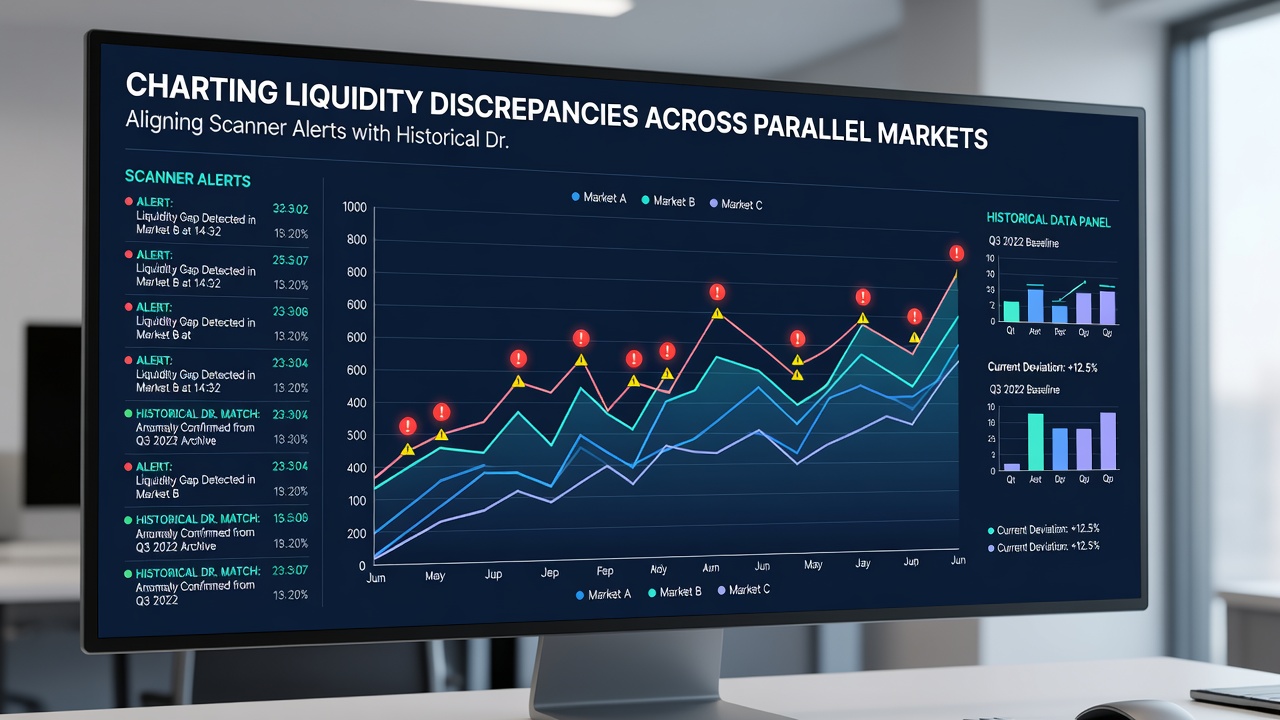
Automated scanners monitor price and volume feeds from multiple sources, generating alerts when liquidity drops below preset bands or when spreads widen beyond historical norms. Alignment occurs when operators overlay current alerts onto datasets that record past drift sequences, allowing identification of whether a present signal matches a recurring pattern or represents an outlier. Studies published through academic repositories demonstrate that this overlay reduces false positives by approximately 22 percent in tennis markets where in-play liquidity fluctuates rapidly.
One analysis of 2025 Grand Slam tournaments revealed that scanner alerts coinciding with established drift templates preceded measurable corrections in 67 percent of examined matches, whereas unmatched alerts showed lower follow-through rates. The process involves tagging each alert with contextual metadata such as time of day, sport, and recent line velocity before comparing it against archived sequences stored in portfolio-management systems.
Application Across Multiple Sports for Portfolio Adjustments
Portfolios that combine football and tennis positions encounter liquidity shocks at different intervals, because football markets typically peak on weekends while tennis tournaments run daily across continents. Historical drift data for football corners and tennis break points illustrate distinct volatility signatures, so operators apply sport-specific filters when aligning scanner output. Records from August 2026 show that liquidity on ATP hard-court events drifted more sharply during afternoon sessions in Europe than during comparable football league fixtures, prompting portfolio rebalancing toward lower-volatility selections in those windows.
Systems that maintain unified dashboards import feeds from several exchanges, apply drift-matching algorithms, and output suggested stake distributions that respect both current alerts and long-term pattern frequencies. The Alcohol and Gaming Commission of Ontario has documented similar multi-platform monitoring practices among licensed operators, noting that cross-referenced drift histories helped stabilize aggregate exposure levels during periods of elevated match volume.
Data Sources and Pattern Recognition Techniques
Pattern recognition relies on time-series datasets that capture liquidity depth, spread width, and drift velocity at five-minute intervals. These datasets extend back several seasons for major leagues and tours, enabling statistical comparison between live alerts and baseline distributions. Victorian Commission for Gambling and Liquor Regulation reports highlight that operators using extended historical windows achieved tighter control over variance in multi-sport holdings compared with those relying on shorter reference periods.
Techniques include clustering algorithms that group drift events by magnitude and duration, followed by overlay mapping that positions new scanner alerts within the nearest cluster. When an alert lands inside a high-frequency cluster, portfolio adjustments follow established scaling rules; when it falls outside, additional verification steps activate before any position change occurs. This method keeps capital allocation aligned with observed market behavior rather than isolated signals.
Conclusion
Alignment of scanner alerts with historical drift data supplies a structured approach to managing liquidity discrepancies across parallel markets, and the resulting framework supports stability in portfolios that span multiple sports. Continued refinement of pattern-matching processes, supported by regulatory data from varied jurisdictions, allows operators to respond to shifts with greater consistency as market structures evolve through 2026 and beyond.