15 Jul 2026
Charting Performance Curves: Aligning Bankroll Allocation with Event Cycles in Competitive Athletics
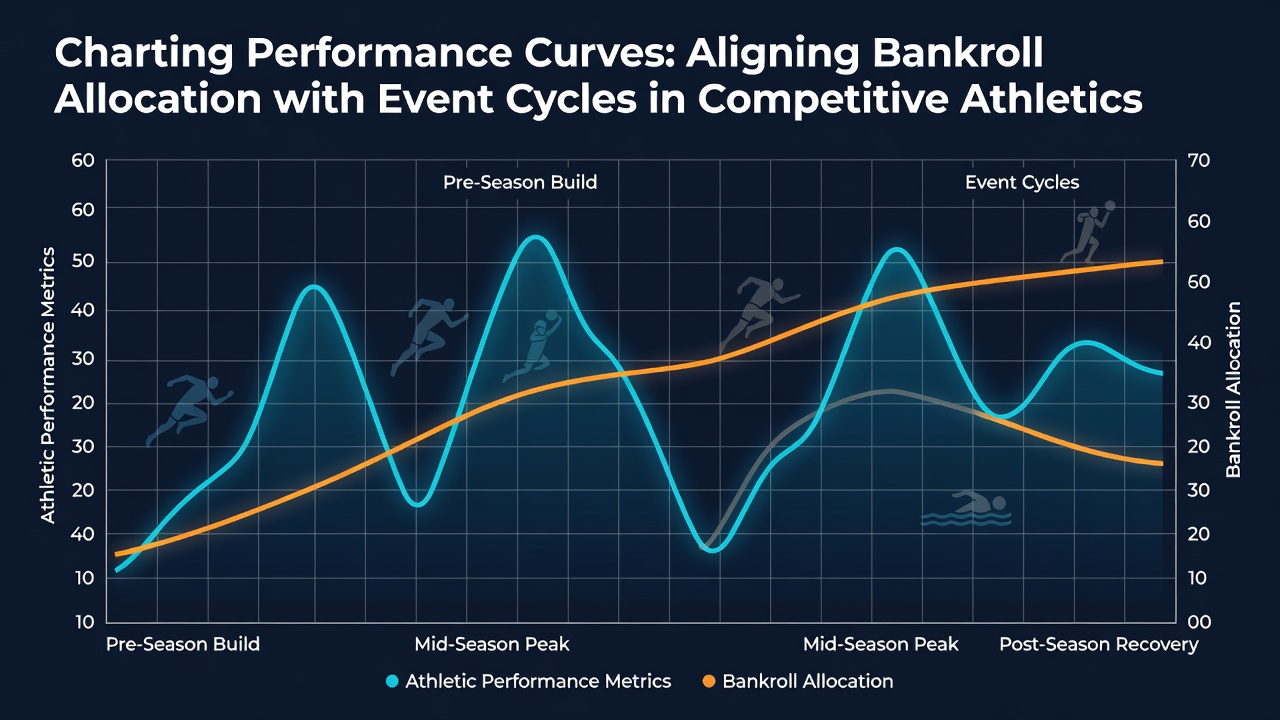 Performance curves in competitive athletics map an athlete's output across weeks and months, showing clear peaks during major competitions and necessary troughs during recovery phases. These visual models help federations and support teams distribute financial resources so funding arrives exactly when preparation intensifies. Data from longitudinal studies indicate that athletes whose budgets align with these natural cycles maintain higher consistency in training loads and competition results. Event cycles in track and field, swimming, and gymnastics follow predictable calendars set by international bodies. The Olympic quadrennial stands as the largest cycle, yet annual sequences of national championships, continental meets, and world championships create smaller repeating patterns. Observers note that resource needs shift dramatically between off-season conditioning blocks and pre-competition sharpening periods, requiring precise timing of equipment purchases, travel support, and specialist coaching contracts.
Mapping the Curve Components
Performance curves typically divide into four stages: base building, specific preparation, competition, and restoration. Each stage demands different spending priorities. Base-building phases emphasize strength facilities and nutrition programs, whereas competition phases require entry fees, medical support, and recovery tools. Researchers at several European sports institutes have documented that mismatched allocations, such as heavy spending on travel during restoration, correlate with measurable drops in subsequent output metrics.
Financial planning tools now incorporate these stages as line items on multi-year budgets. Software used by national Olympic committees plots projected expenses against historical performance data, highlighting periods when capital reserves should remain liquid. This approach prevents premature depletion of funds during long qualification windows that stretch across multiple seasons.
Event Cycles and Resource Timing
Major competitions cluster in summer months for most outdoor disciplines. July 2026 features several continental championships that fall between Olympic cycles, creating an intermediate peak that still requires dedicated funding for acclimatization camps and equipment upgrades. Those who manage athlete portfolios adjust allocations six to eight months ahead, releasing larger tranches for travel and tapering protocols while keeping smaller monthly stipends steady during lower-intensity periods.
Studies from Canadian and Australian research centers show that athletes receiving staged funding tied to verified performance markers sustain longer careers than those on flat annual grants. The data reveal reduced injury rates when recovery budgets activate immediately after major events rather than on arbitrary calendar dates.

Practical Alignment Methods
Teams begin by collecting baseline metrics from wearable devices and competition results, then overlay the upcoming event calendar to identify funding inflection points. Contracts with sponsors often include performance clauses that trigger additional payments once an athlete reaches a defined ranking threshold, providing automatic capital increases precisely when the next cycle demands intensified preparation.
National governing bodies in several regions publish annual calendars eighteen months in advance, allowing support staff to model cash-flow scenarios. One documented approach involves creating three parallel budgets: a core training allocation released monthly, a competition surge fund activated by qualification, and an emergency reserve held for unexpected medical or travel needs. This layered structure matches the rhythm of performance curves without requiring constant renegotiation of resources.
Monitoring and Adjustment
Regular curve reviews occur at the end of each mesocycle, typically every four to six weeks. Metrics such as power output, recovery scores, and competition placement feed back into the financial model, prompting reallocation if an athlete advances or regresses faster than projected. Academic papers from university sports science departments emphasize that dynamic models outperform static annual plans because they respond to real physiological data rather than fixed assumptions.
Software platforms now integrate live feeds from competition results databases, automatically flagging when an athlete's trajectory deviates from the planned curve and suggesting corresponding budget shifts. Federations using these systems report more accurate forecasting of total annual expenditure across entire squads.
Conclusion
Aligning bankroll decisions with performance curves and event cycles produces measurable improvements in athlete availability and output consistency. Organizations that treat funding as a dynamic variable synchronized to competition calendars, rather than a fixed annual sum, position their athletes for sustained success across multiple seasons. Continued refinement of these models through data integration and staged releases supports the long-term development required in high-level competitive athletics.